Six hundred thousand a second
Introduction
I recently came across a fascinating blog by Zomato Engineering detailing how they rebuilt their logging system to handle an impressive 150 million logs per minute using ClickHouse.
blog.zomato.com — Building a cost-effective logging platform using ClickHouse for petabyte scaleThis inspired me to build my own log ingestor as a learning project. In this blog post, I’ll walk you through the architecture and implementation details of my log ingestor system, focusing on how it efficiently collects, buffers, and stores logs at scale.
github.com — Mukund-Tandon/LoggerSystem Overview
My log ingestor system consists of four main components:
- Log Ingestor: Collects logs from various sources and stores them in ClickHouse
- Node.js Server: Provides an API for the dashboard to query logs
- React Dashboard: Visualizes and allows querying of logs
- SDKs: Client libraries for applications to send logs to the ingestor
In this post, I’ll focus specifically on the Log Ingestor component, which is built in Go and designed for high throughput.
The Log Ingestor supports three input methods:
- HTTP endpoints (initially used for testing)
- gRPC services (implemented as a learning exercise)
- Kafka topics (the primary production method)
Architecture Deep Dive
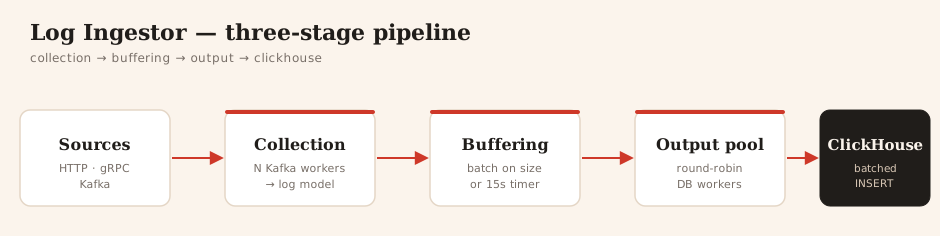
The Log Ingestor follows a three-stage pipeline architecture:
- Collection: Retrieving logs from sources
- Buffering: Batching logs for efficient processing
- Output: Storing logs in ClickHouse
Let’s examine each stage in detail.
1. Collection Stage
The collector is responsible for retrieving logs from sources and transforming them into a standardized format. For Kafka collection, which is our primary focus, I implemented a multi-worker approach for parallel processing.
Here’s the KafkaCollector struct that handles this:
type KafkaCollector struct {
    logbufferChannel chan models.Log
    brokers          []string
    topic            string
    groupID          string
    numWorkers       int
    readers          []*kafka.Reader
    ctx              context.Context
    cancel           context.CancelFunc
    wg               sync.WaitGroup
}
Let’s break down these fields:
logbufferChannel: Channel to send logs to the buffer stagebrokers: List of Kafka broker addressestopic: Kafka topic to consume logs fromgroupID: Consumer group ID for the Kafka consumernumWorkers: Number of parallel consumer goroutinesreaders: Array of Kafka readers (one per worker)ctxandcancel: For graceful shutdown handlingwg: WaitGroup to track active goroutines
The collector starts multiple parallel workers, each with its own Kafka reader:
for i := 0; i < c.numWorkers; i++ {
    workerID := strconv.Itoa(i)

    reader := kafka.NewReader(readerConfig)
    c.readers[i] = reader

    fmt.Printf("Starting worker goroutine %s\n", workerID)
    c.wg.Add(1)

    go func(r *kafka.Reader, id string) {
        defer c.wg.Done()
        c.consumeMessages(r, id)
    }(reader, workerID)
}
Each worker runs the consumeMessages method in its own goroutine:
func (c *KafkaCollector) consumeMessages(reader *kafka.Reader, workerID string) {
    fmt.Printf("Worker %s: Starting message consumption\n", workerID)

    defer func() {
        fmt.Printf("Worker %s: Closing Kafka reader\n", workerID)
        reader.Close()
    }()

    for {
        select {
        case <-c.ctx.Done():
            fmt.Printf("Worker %s: Context canceled, stopping\n", workerID)
            return
        default:
            message, err := reader.ReadMessage(c.ctx)
            if err != nil {
                if err == context.Canceled {
                    fmt.Printf("Worker %s: Context canceled while reading message\n", workerID)
                    return
                }
                fmt.Printf("Worker %s: Error reading Kafka message: %v\n", workerID, err)
                time.Sleep(500 * time.Millisecond) // Brief pause before retrying
                continue
            }

            log, err := transformer.KafkaEventToLog(message)
            if err != nil {
                fmt.Printf("Worker %s: Error transforming Kafka message: %v\n", workerID, err)
                continue
            }

            c.logbufferChannel <- log
        }
    }
}
Each message is transformed from the Kafka format to our internal log model:
type Log struct {
   Timestamp  string
   Level      string
   Message    string
   ResourceID string
}
The transformation is handled by a simple function:
func KafkaEventToLog(msg kafka.Message) (models.Log, error) {
    var log models.Log

    err := json.Unmarshal(msg.Value, &log)
    if err != nil {
        return models.Log{}, err
    }

    return log, nil
}
2. Buffering Stage
The buffer stage collects individual logs and groups them into batches for efficient database insertion. This is crucial for high-throughput systems, as batch operations are much more efficient than individual inserts.
Here’s the buffer implementation:
func LogBuffer(logBatchOutputChannel chan models.Logbatch, metricsLogger *metrics.MetricsLogger) chan models.Log {
    logChannel := make(chan models.Log)
    buffer := make([]models.Log, 0, 4000)
    ticker := time.NewTicker(15 * time.Second)

    go func() {
        for {
            select {
            case log := <-logChannel:
                buffer = append(buffer, log)
                if len(buffer) >= 4000 {
                    logBatchOutputChannel <- models.Logbatch{Logbatch: buffer}
                    buffer = buffer[:0]
                }
            case <-ticker.C:
                if len(buffer) > 0 {
                    logBatchOutputChannel <- models.Logbatch{Logbatch: buffer}
                    buffer = buffer[:0] // Clear the buffer
                }
                ticker.Reset(15 * time.Second)
            }
        }
    }()

    return logChannel
}
The buffer flushes logs to the output stage under two conditions:
- When the buffer reaches 4000 logs (size-based trigger)
- When 15 seconds have passed since the last flush (time-based trigger)
This dual-trigger approach ensures both efficiency (batch size) and timeliness (maximum delay).
3. Output Stage
The output stage is responsible for inserting batches of logs into ClickHouse. To maximize throughput, I implemented a worker pool pattern with multiple database connections:
type OutputPool struct {
    workers       []*Worker
    inputChannel  chan models.Logbatch
    metricsLogger *metrics.MetricsLogger
    wg            sync.WaitGroup
    ctx           context.Context
    cancel        context.CancelFunc
}

type Worker struct {
    id            string
    conn          clickhouse.Conn
    inputChannel  chan models.Logbatch
    metricsLogger *metrics.MetricsLogger
    ctx           context.Context
    wg            *sync.WaitGroup
}
The pool dispatcher distributes incoming batches to workers using a round-robin approach:
func (p *OutputPool) dispatch() {
    fmt.Println("Output dispatcher started")

    currentWorker := 0
    numWorkers := len(p.workers)

    for {
        select {
        case <-p.ctx.Done():
            fmt.Println("Dispatcher shutting down")
            return

        case batch := <-p.inputChannel:
            // Round-robin distribution
            p.workers[currentWorker].inputChannel <- batch
            currentWorker = (currentWorker + 1) % numWorkers
        }
    }
}
Each worker processes batches independently using its own database connection:
func (w *Worker) work() {
    defer w.wg.Done()
    fmt.Printf("Worker %s started processing\n", w.id)

    for {
        select {
        case <-w.ctx.Done():
            fmt.Printf("Worker %s shutting down\n", w.id)
            if w.conn != nil {
                w.conn.Close()
            }
            return

        case batch := <-w.inputChannel:
            fmt.Printf("Worker %s processing batch of size %d\n", w.id, len(batch.Logbatch))

            // Insert the batch
            err := doBatchInsert(batch, w.conn)

            // Record metrics for successful insertions
            if err == nil && w.metricsLogger != nil {
                w.metricsLogger.RecordDBInsertion(len(batch.Logbatch))
                fmt.Printf("Worker %s recorded insertion of %d logs\n", w.id, len(batch.Logbatch))
            } else if err != nil {
                fmt.Printf("Worker %s error inserting batch: %v\n", w.id, err)
            }
        }
    }
}
The batch insertion into ClickHouse is handled efficiently:
func doBatchInsert(logbatch models.Logbatch, conn clickhouse.Conn) error {
    ctx := context.Background()
    batch, err := conn.PrepareBatch(ctx, "INSERT INTO logs")
    if err != nil {
        fmt.Println("Error preparing batch:", err)
        return err
    }

    logBatchSize := len(logbatch.Logbatch)
    for i := 0; i < logBatchSize; i++ {
        timestampStr := logbatch.Logbatch[i].Timestamp

        // Parse timestamp
        timestamp, err := time.Parse(time.RFC3339Nano, timestampStr)
        if err != nil {
            fmt.Printf("Error parsing timestamp %s: %v\n", timestampStr, err)
            continue // Skip this entry if timestamp parsing fails
        }

        // Format for ClickHouse
        clickHouseInsertFormat := timestamp.Format("2006-01-02 15:04:05.000000")

        // Extract log fields
        message := logbatch.Logbatch[i].Message
        level := logbatch.Logbatch[i].Level
        resourceID := logbatch.Logbatch[i].ResourceID

        // Append to batch
        err = batch.Append(
            clickHouseInsertFormat,
            level,
            message,
            resourceID,
        )
        if err != nil {
            fmt.Println("Error executing query:", err)
            return err
        }
    }

    // Execute the batch insert
    err = batch.Send()
    if err != nil {
        fmt.Println("Error sending batch:", err)
        return err
    }

    return nil
}
System Flow
Let’s trace a log’s journey through the system:
- An application sends a log message to a Kafka topic
- One of the Kafka consumer workers reads the message
- The message is transformed into our standard log format
- The log is sent to the buffer
- The buffer collects logs until reaching 1000 or 15 seconds passes
- The batch is sent to the output stage
- The round-robin dispatcher assigns the batch to a worker
- The worker inserts the batch into ClickHouse
- The logs are now available for querying via the dashboard
Performance Considerations
This architecture is designed for high throughput with several key optimizations:
- Parallel consumption: Multiple Kafka workers to process incoming messages concurrently
- Efficient batching: Size-based and time-based triggers balance throughput and latency
- Connection pooling: Multiple database workers with dedicated connections
- Round-robin distribution: Even distribution of workload among database workers
Now that we have built our log ingestor, it’s time to test its performance
Log Ingestor Metrics Collection
To accurately measure the performance of our log ingestor, I implemented a simple but effective metrics collection system that tracks database insertions. The metrics package is focused on recording the number of logs inserted into ClickHouse and calculating insertion rates over time:
package metrics

import (
	"fmt"
	"os"
	"sync"
	"time"
)

type MetricsLogger struct {
	totalInserted int64     // Total logs inserted since start
	prevInserted  int64     // Logs inserted as of last measurement
	lastLogTime   time.Time // Timestamp of last measurement
	logFile       *os.File  // File to write metrics data
	mu            sync.Mutex // Mutex to protect concurrent access
}

func NewMetricsLogger(logFilePath string) (*MetricsLogger, error) {
	// Open metrics log file
	file, err := os.OpenFile(logFilePath, os.O_APPEND|os.O_CREATE|os.O_WRONLY, 0644)
	if err != nil {
		return nil, fmt.Errorf("failed to open metrics log file: %w", err)
	}

	// Write CSV header if file is new
	fileInfo, err := file.Stat()
	if err == nil && fileInfo.Size() == 0 {
		headerLine := "timestamp,logs_per_second,total_logs_inserted\n"
		if _, err := file.WriteString(headerLine); err != nil {
			return nil, fmt.Errorf("failed to write header to metrics log file: %w", err)
		}
	}

	return &MetricsLogger{
		lastLogTime: time.Now(),
		logFile:     file,
	}, nil
}

// RecordDBInsertion increments the counter when logs are inserted to ClickHouse
func (m *MetricsLogger) RecordDBInsertion(count int) {
	m.mu.Lock()
	defer m.mu.Unlock()

	m.totalInserted += int64(count)
}

// LogInsertionRate calculates and logs the current insertion rate
func (m *MetricsLogger) LogInsertionRate() error {
	m.mu.Lock()
	defer m.mu.Unlock()

	now := time.Now()
	timeSinceLast := now.Sub(m.lastLogTime).Seconds()
	insertedSinceLast := m.totalInserted - m.prevInserted

	// Calculate insertion rate (logs per second)
	insertionRate := float64(insertedSinceLast) / timeSinceLast

	// Format and write the log entry
	logLine := fmt.Sprintf("%s,%.2f,%d\n",
		now.Format(time.RFC3339),
		insertionRate,
		m.totalInserted)

	if _, err := m.logFile.WriteString(logLine); err != nil {
		return fmt.Errorf("failed to write to metrics log file: %w", err)
	}

	// Update tracking variables for next measurement
	m.lastLogTime = now
	m.prevInserted = m.totalInserted

	return nil
}

// StartPeriodicLogging begins a background goroutine to log metrics at the specified interval
func (m *MetricsLogger) StartPeriodicLogging(interval time.Duration) {
	ticker := time.NewTicker(interval)

	go func() {
		for range ticker.C {
			if err := m.LogInsertionRate(); err != nil {
				fmt.Fprintf(os.Stderr, "Error logging metrics: %v\n", err)
			}
		}
	}()
}

// Close properly closes the metrics log file
func (m *MetricsLogger) Close() error {
	m.mu.Lock()
	defer m.mu.Unlock()

	if m.logFile != nil {
		return m.logFile.Close()
	}
	return nil
}
I integrated this metrics logger into our output workers to track database insertions:
// In worker.work() method
case batch := <-w.inputChannel:
    fmt.Printf("Worker %s processing batch of size %d\n", w.id, len(batch.Logbatch))

    // Insert the batch
    err := doBatchInsert(batch, w.conn)

    // Record successful insertions in metrics
    if err == nil && w.metricsLogger != nil {
        w.metricsLogger.RecordDBInsertion(len(batch.Logbatch))
    } else if err != nil {
        fmt.Printf("Worker %s error inserting batch: %v\n", w.id, err)
    }
And started the metrics logger in our main function:
func main() {
    // Create metrics logger
    metricsLogger, err := metrics.NewMetricsLogger("ingestor_metrics.csv")
    if err != nil {
        fmt.Printf("Error creating metrics logger: %v\n", err)
        os.Exit(1)
    }
    defer metricsLogger.Close()

    // Start periodic logging every 1 seconds
    metricsLogger.StartPeriodicLogging(1 * time.Second)

    // ... rest of setup code
}
This metrics system provides valuable data on:
- Insertion Rate: How many logs per second are being written to ClickHouse
- Total Inserted: The cumulative count of logs stored in the database
- Performance Over Time: The CSV format allows for visualization and analysis of performance trends
During testing, we can monitor these metrics to understand how our log ingestor performs under various load conditions. The metrics are particularly useful for identifying performance bottlenecks and validating the effectiveness of our batching and worker pool strategies.
The CSV format also makes it easy to generate graphs and visualizations of the ingestor’s performance using tools like Excel, Python’s matplotlib, or data visualization platforms.
Below is a blog you can read if you want to see how I was able to generate a million logs per second locally to test this infrastructure.
hashnode.dev — Can I send 1 million logs per second to Kafka locally?Performance Journey: From 8K to 1 Million Logs/Second
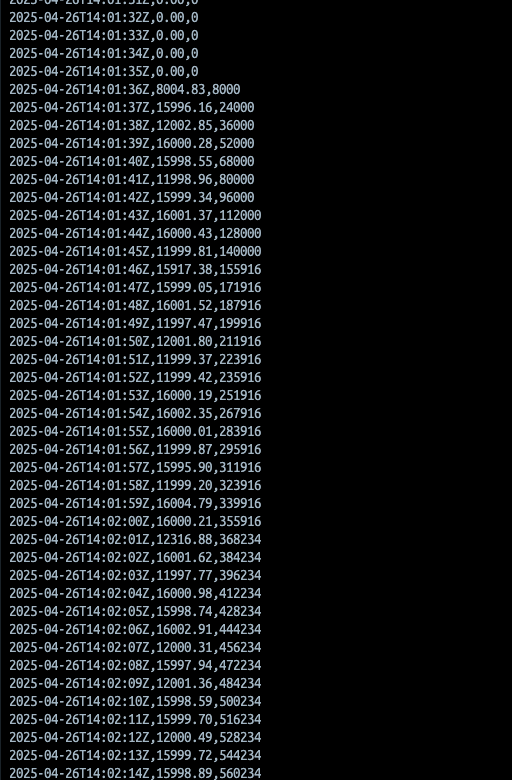
My initial implementation processed around 12,000-16,000 logs per second while receiving around 800K logs per second. Here’s how I optimized the system step by step:
1. Increasing Batch Size (4K → 40K)
The first optimization was increasing the buffer size from 4,000 to 40,000 logs:
buffer := make([]models.Log, 0, 40000)Result: Throughput seems to have doubled to about 40,000 logs/second, but buffer fill time increased to 2-3 seconds as we can see 0 logs processed per second also. This indicated that the bottleneck was in the Kafka consumer’s ability to fill the buffer quickly enough.
2. Optimizing Kafka Consumer Configuration
After
readerConfig := kafka.ReaderConfig{
    Brokers:         c.brokers,
    Topic:           c.topic,
    GroupID:         c.groupID,
    MinBytes:        10e3,        // 10KB minimum batch size
    MaxBytes:        20e6,        // 20MB maximum batch size
    MaxWait:         1 * time.Second,
    StartOffset:     kafka.FirstOffset,
    ReadLagInterval: -1,
    CommitInterval:  1 * time.Second, // The key improvement
}
Before
readerConfig := kafka.ReaderConfig{
    Brokers:         c.brokers,
    Topic:           c.topic,
    GroupID:         c.groupID,
    MinBytes:        10e3,
    MaxBytes:        10e6,        // Only 10MB
    MaxWait:         1 * time.Second,
    StartOffset:     kafka.FirstOffset,
    ReadLagInterval: -1,
    // No CommitInterval
}
The Critical CommitInterval Addition
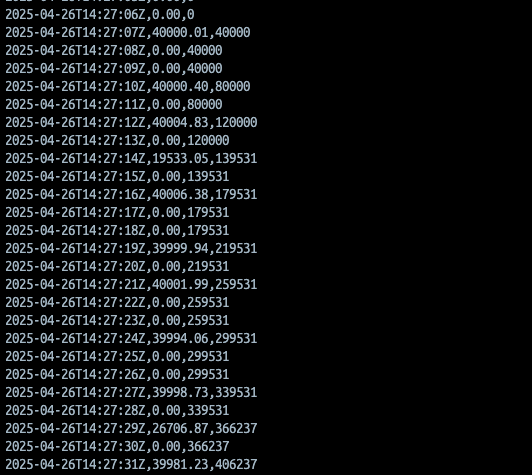
The single most impactful change here was the addition of the CommitInterval: 1 * time.Second parameter, which transformed your throughput from ~16K to nearly 350K logs/second on average—a remarkable improvement from just one parameter.
How CommitInterval Works
In Kafka’s consumer model, offsets track which messages have been processed. By default, without a CommitInterval specified, the Kafka Go client commits offsets automatically after processing each message or batch. This creates substantial coordination overhead:
- Without CommitInterval: The client makes a network request to Kafka’s coordinator for nearly every batch of messages processed, creating a synchronous bottleneck
- With CommitInterval: 1 * time.Second: Commits are batched and sent just once per second, regardless of how many message batches are processed in that second
Performance Impact
This change had several cascading effects:
- Reduced Coordination Traffic: With your system processing hundreds of thousands of logs per second, this reduced coordination traffic by approximately 99%
- Lower Broker Load: Kafka brokers experienced significantly less load from handling commits, freeing resources for actual message delivery
- Reduced Round-Trip Latency: Eliminating per-batch commits removed a synchronous wait from your processing pipeline
- Increased Throughput Ceiling: Without the constant commit bottleneck, your system could approach the true maximum throughput of your network and CPU resources
The MaxBytes setting to 8MB
Below are rough calculations as to why 8MB seems perfect for max byte — remember, below are just rough estimates.
The Partition Throughput Calculation
My configuration is precisely calibrated to my partitioned architecture:
- Total System Throughput: 800,000 logs/second
- Number of Partitions: 10 partitions
- Per-Partition Throughput: 800,000 ÷ 10 = 80,000 logs/second per partition
Log Size and Compression Analysis
Each log entry has specific size characteristics:
- Average uncompressed log size: ~500 bytes (including timestamp, level, message, resourceID, and JSON overhead)
- Kafka compression ratio: ~5:1 (typical for log data using Snappy)
- Compressed log size: ~100 bytes per log
Data Flow Rate Calculation
For each partition:
- Uncompressed Data Rate:
- 80,000 logs/second × 500 bytes = 40,000,000 bytes/second (40MB/s)
- Compressed Data Rate:
- 40MB/s ÷ 5 = 8MB/second of compressed data flowing through each partition
Final output
During testing, I noticed that when producing and consuming logs simultaneously on the same machine, throughput was around 280K logs/second. Once the producer finished, throughput increased to 500K logs/second.
This revealed resource competition between producer and consumer processes on my 10-core machine. Both were competing for:
- CPU resources
- Network bandwidth
- Disk I/O
- Memory and cache
Testing out various buffer configurations, input throughput is around 600K logs/second.
| Buffer Size | Maximum Throughput after 15s | Minimum | Comments during first 15 seconds |
|---|---|---|---|
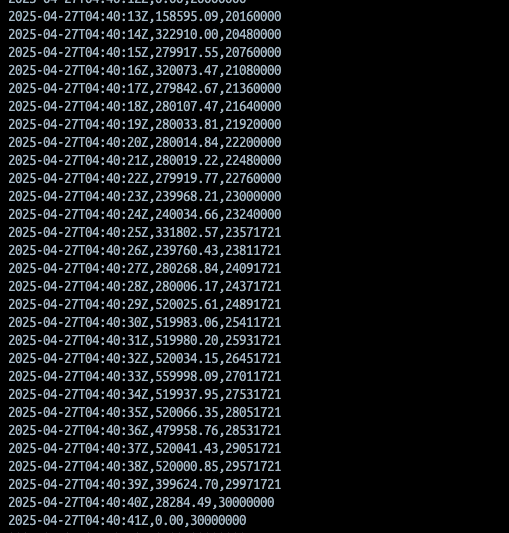
| 40000 | 559998.0 | 399624.70 | 150K to 330K throughput |
| 100000 | 600019.53 | 399907.50 | 200K to 400K, averaging mostly around 299K |
| 150000 | 750038.2 | 449873.74 | throughput of 150K to 450K |
| 300000 | 714548.64 | 299997.70 | averaging 300K logs/second but sometimes buffer takes 2 seconds to fill |
| 500000 | 999960.54 | 499994.27 | Buffer was taking 2 seconds to fill, so on alternate seconds we got 500K logs/second |
| 600000 | 1200064.64 | 528747.74 | similar to 500K buffer — buffer takes 2-3s to fill, then 600K logs/second or sometimes more |
Screenshots of various buffer size tests
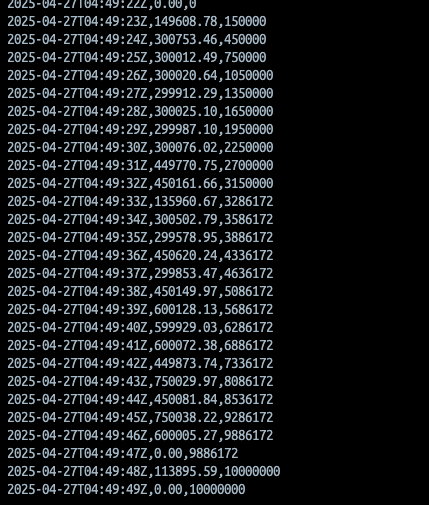
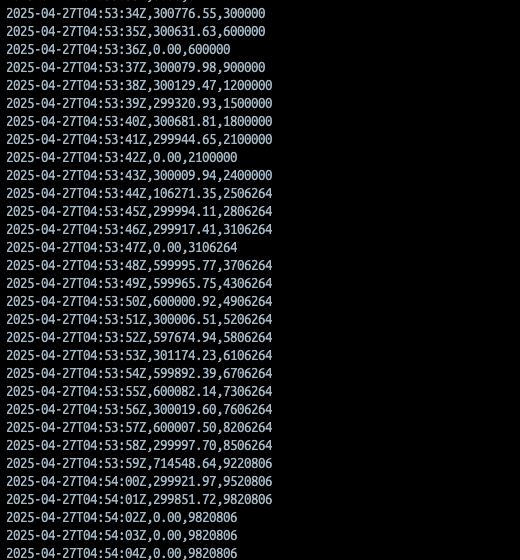
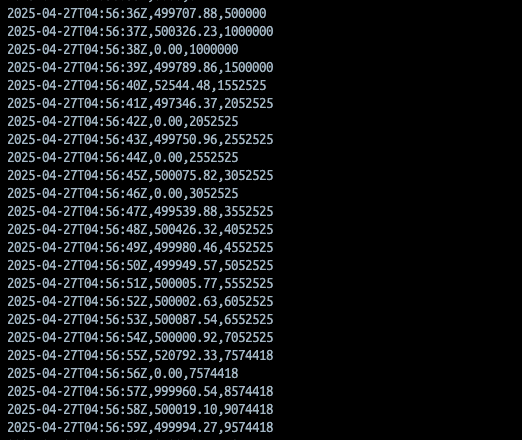
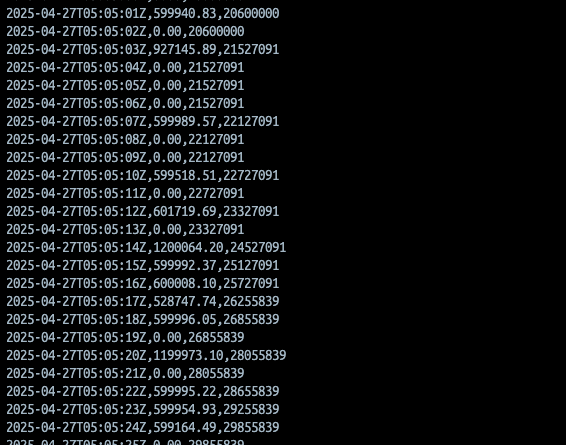
During my optimization work, I conducted extensive testing of various buffer sizes to understand their impact on throughput performance. Each configuration revealed distinct behavioral patterns in our log ingestion pipeline. The 40K buffer showed consistent throughput between 399K-559K logs/second. The 100K buffer achieved peaks of 600K logs/second while maintaining a similar floor of around 400K logs/second. Moving to 150K, we observed higher peak throughput of 750K logs/second with improved minimum performance of 450K logs/second. The 300K configuration reached 714K logs/second but occasionally required 2 seconds to fill, creating a processing rhythm. Most notably, the 500K buffer demonstrated peaks approaching 1 million logs/second with 2-second fill cycles, while the 600K buffer reached extraordinary throughput of 1.2 million logs/second with slightly longer 2-3 second fill cycles and a baseline of approximately 530K logs/second. These measurements provided valuable insights into the relationship between buffer size, processing patterns, and throughput characteristics across different workload conditions. Also, despite our ingress throughput being around 600K logs/second, we saw a max throughput of 1.2 million because before such high throughput we observed no logs being sent in the previous second, so they were suddenly flushed to the database, making our metrics record 1.2 million.
Conclusion: Building a Million-Message Log Ingestor
Throughout this journey of building and optimizing a log ingestor system, I’ve demonstrated how a thoughtfully designed architecture can scale to handle massive throughput requirements. What began as a learning project inspired by Zomato Engineering’s approach evolved into a high-performance system capable of processing over 1.2 million logs per second.
The three-stage pipeline architecture—collection, buffering, and output—proved to be a robust foundation. Each component was designed with concurrency and efficiency in mind, from the multi-worker Kafka consumers to the batched ClickHouse insertions. This modular approach not only made the system easier to reason about but also simplified the optimization process by allowing targeted improvements at each stage.
Perhaps the most valuable insight from this project was understanding how seemingly small configuration changes can yield dramatic performance improvements. The Kafka consumer optimizations, particularly the CommitInterval setting, transformed throughput by reducing coordination overhead. Similarly, the extensive buffer size testing revealed fascinating patterns in how system behavior changes across different configurations, offering a glimpse into the complex interplay between memory usage, latency, and processing rhythm.
This project also reinforced the importance of metrics and measurement in performance optimization. By implementing a simple but effective metrics collection system, I was able to quantify improvements, identify bottlenecks, and make data-driven decisions about configuration changes.
Building a high-throughput log ingestor isn’t just about raw performance—it’s about creating a system that can reliably handle production workloads with predictable behavior. The optimizations described here have applications beyond logging systems, offering valuable lessons for any high-throughput data processing pipeline.
While the current implementation has achieved impressive results, there’s always room for further improvement through horizontal scaling, additional configuration tuning, and exploration of new technologies. However, the fundamental principles of batch processing, parallel execution, and careful configuration management will remain relevant regardless of the specific implementation details.
As data volumes continue to grow across industries, the ability to efficiently ingest, process, and store massive log volumes becomes increasingly crucial. I hope this exploration provides valuable insights for others building similar systems in their own environments.